Portfolio Diversification Report
This functionality is specifically for SRI
To view and download portfolio diversification report,
follow the below steps:
1. Click on Reports and
Analytics in the main menu.

2. You can access the report from the dashboard by clicking Portfolio Diversification in the Portfolio panel or from
the Portfolio drop-down menu in the blue vertical bar.
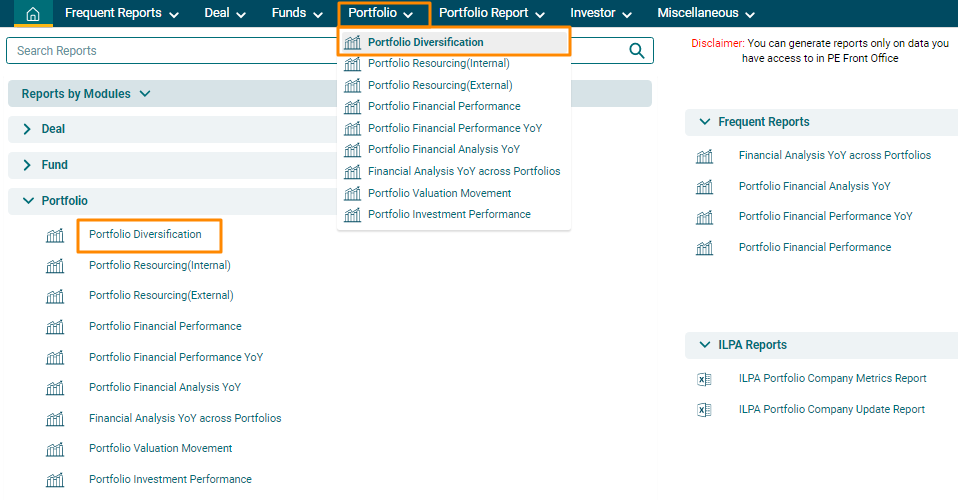
3. The Portfolio | Diversification
window is displayed. It displays the data in the Pie Chart form based on the
set parameters.
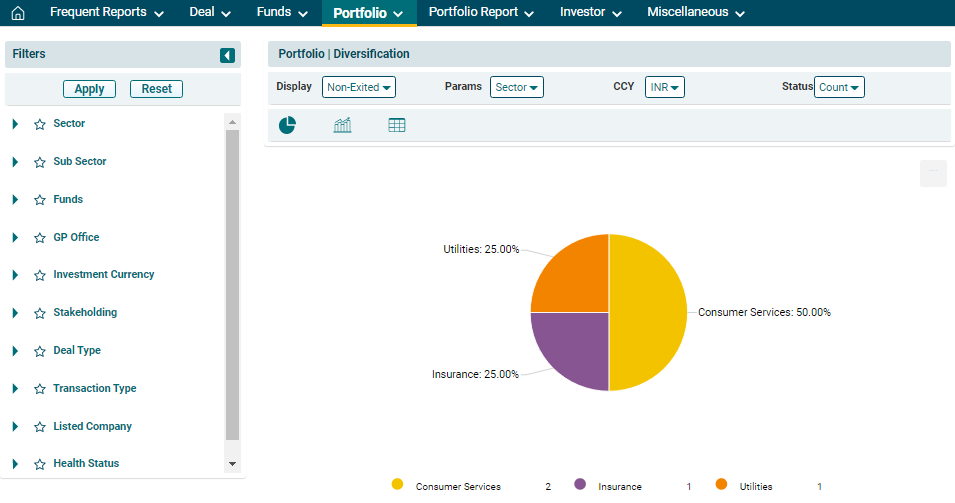
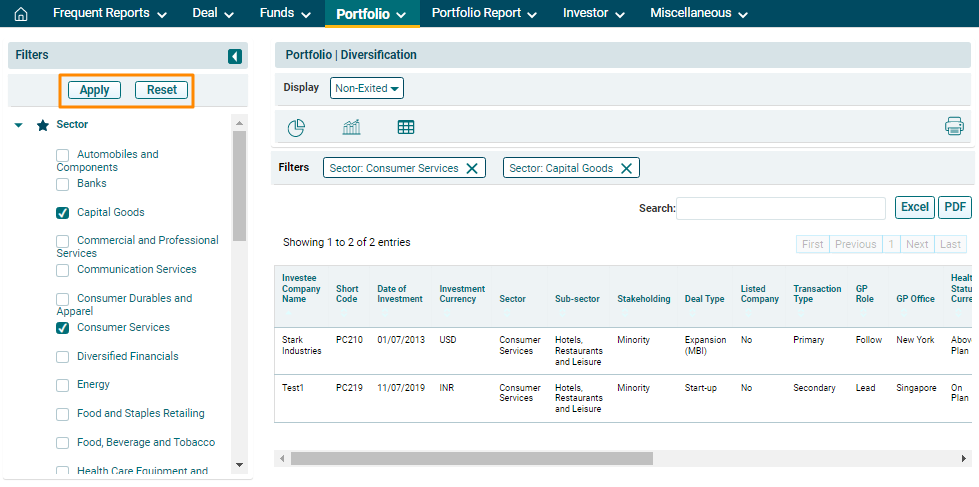
4. You can also view the report using various filters available above the graph.
- Display: To view all the portfolio companies including Exited, Non-Exited, or Both Exited and Non-Exited.
- Params: To
view all the companies based on Sector, Deal type, Sub-sector, Stakeholding,
Transaction Type, Health Status, GP Office, etc. .
- Currency- To view the charts based on different currencies.
- Status: To view the charts based on Count, Investment Cost,
Current Cost, or Current Valuation.
After applying
the filters, you can view the chart based on the changed parameters.
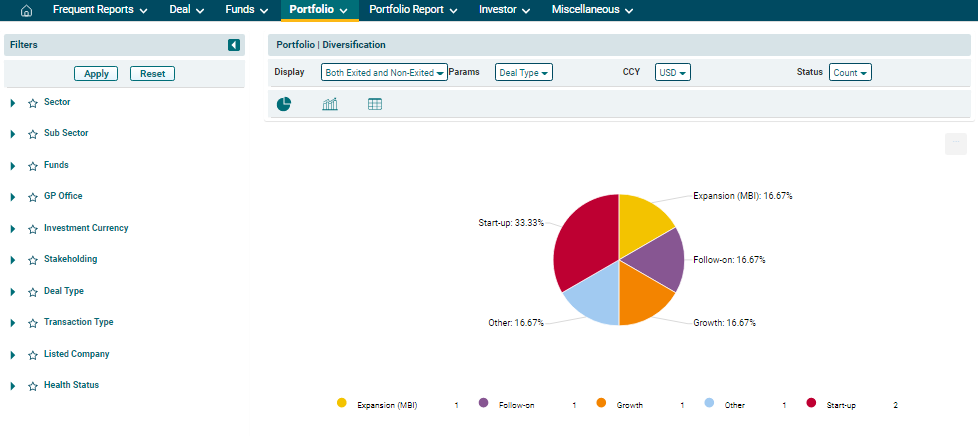
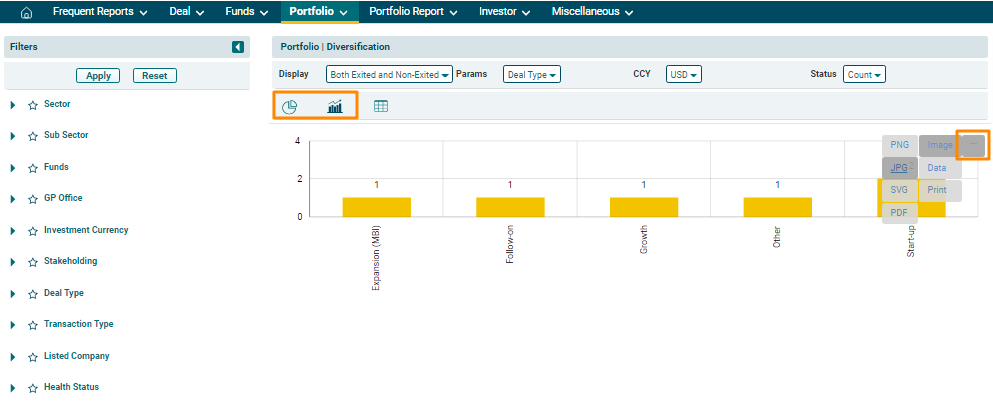
5. You can view
the above data in Bar Graph and Pie chart. Click on the icons below the filters to view the
diversification in the desired format. You can download the report in various
formats. Click on the gray square box button in the top right corner near the
graph. The report can be downloaded in image formats, such as PNG, SVG, JPG,
etc., and data formats, such as JSON, HTML, PDF, CSV, etc. Click on a format
and the report will be downloaded.
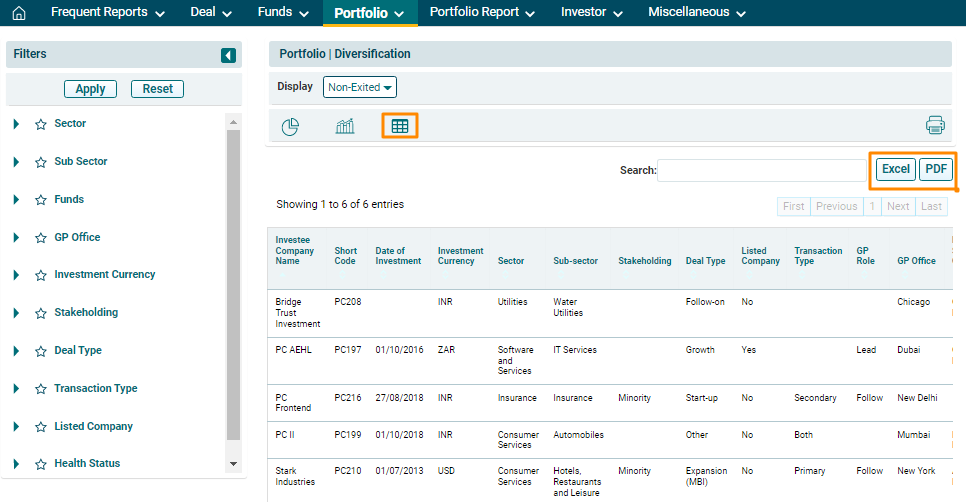
6. You can also
view the underlying dataset for the above graphs. Click on the Data Set icon. You can download the dataset
in Excel and PDF format. Click on the desired format to
download.
7. To further drill down into the analysis, use the additional filters on the left-hand side. Select a filter and click on Apply. To reset the filters, click Reset.