Deal Pipeline
Pipeline Snapshot Report (Quarterly)
This functionality is specifically for SRI
To view
and download multiple charts containing details of all the deals, you can use the Pipeline Snapshot Report.
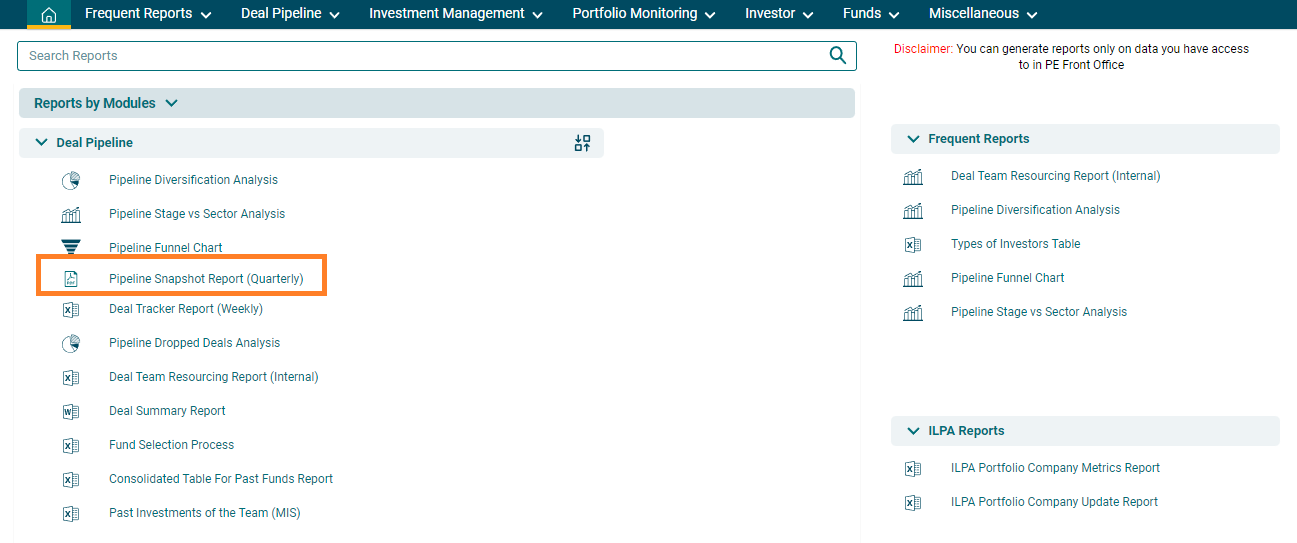
1. Click on Reports and Analytics in the main menu.

2. You can
access the report from the dashboard by clicking Pipeline Snapshot Report (Quarterly) in the Deal
panel or from the Deal drop-down
menu in the blue vertical bar.
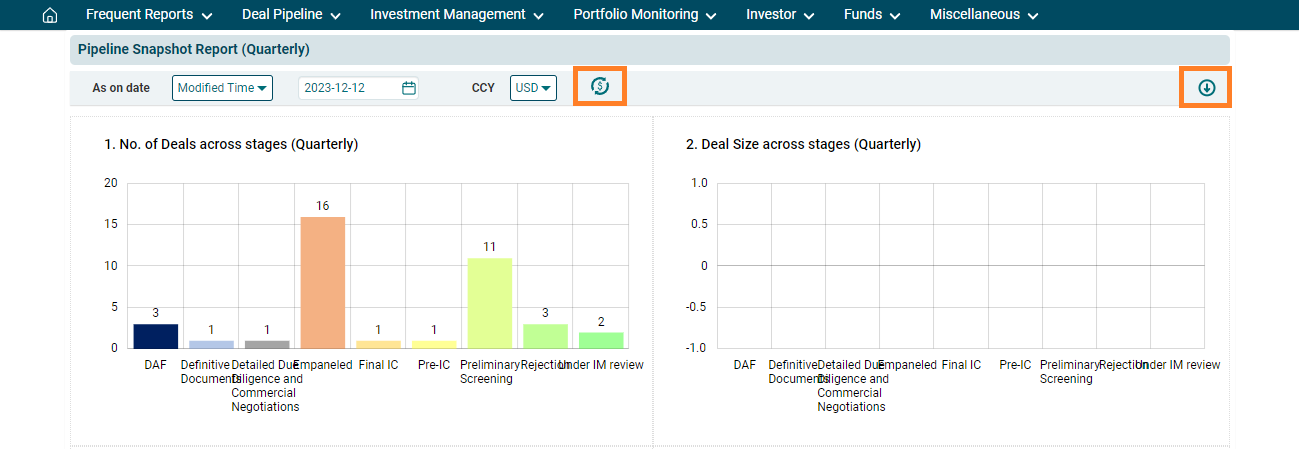
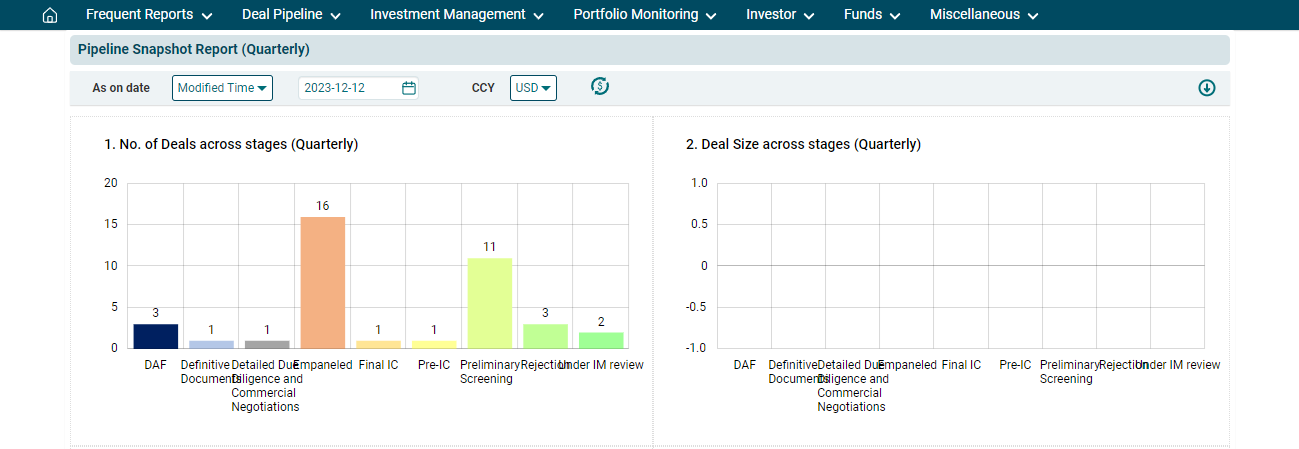
3. The Deal Pipeline Snapshot window is
displayed. You can see six charts displayed. These charts depict:
- No. of Deals across stages
(Quarterly): Depicts different deals across various stages.
- Deal Size across stages (Quarterly): Depicts the Deal Size value
across various stages.
- Industry Breakdown: Depicts the industries involved.
- Deals by source: Depicts the Deal origination
source.
- No. of Deals Trend: Depicts the number of deals generated across quarters.
- No. of Deal Size Trend: Depicts the number of Deal Size generated across quarters.
You can
also view the report using various filters available above the graph.
- Date: To view the chart for a particular date range, select the date and specify the filter for data based on Created Time, Modified Time, and Date Opened.
- Currency: To view the data based on different currencies.
4. Click on Refresh Data icon after applying the
filters. Click on Save as PDF icon to
download the report. The file will be downloaded.