Reports And Analytics
Financial Analysis YoY Across Portfolios
This functionality is only accessible to SRI
To view and download reports, follow the below steps:
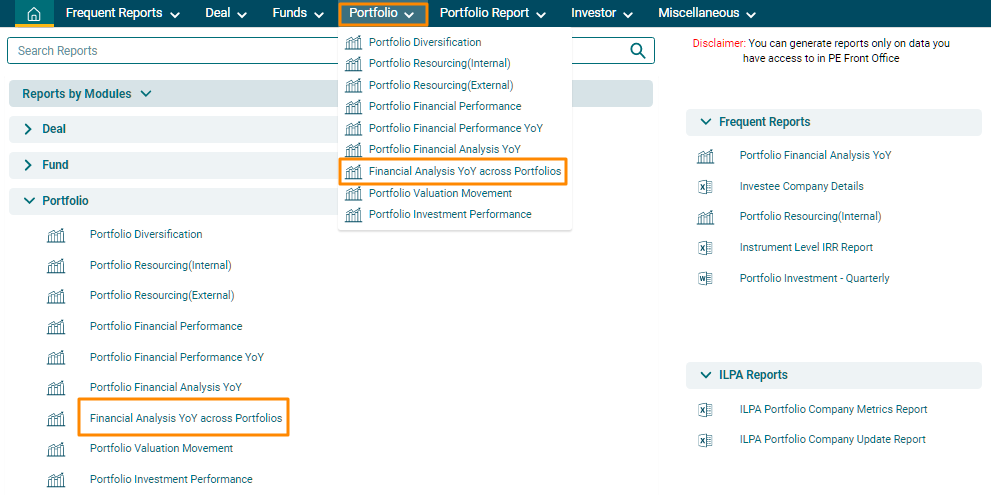
1. Click on Reports and Analytics in the main menu.
 2. You can access the report from the dashboard by clicking Financial Analysis YoY Across Portfolios in the Portfolio panel or from the Portfolio drop-down menu in the blue vertical bar.
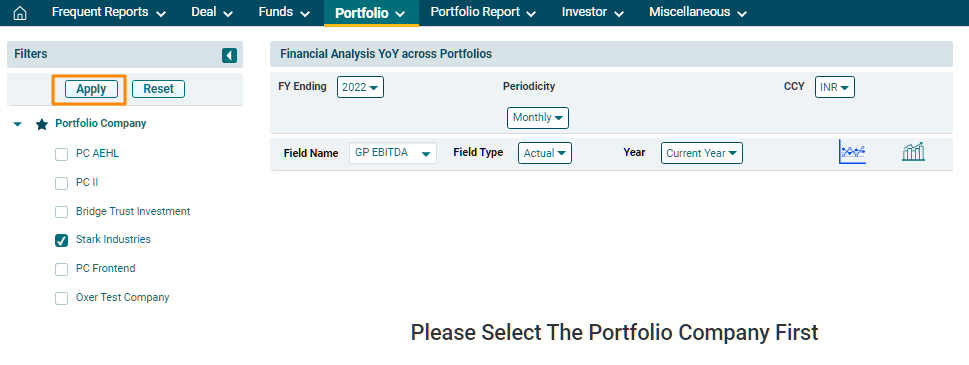
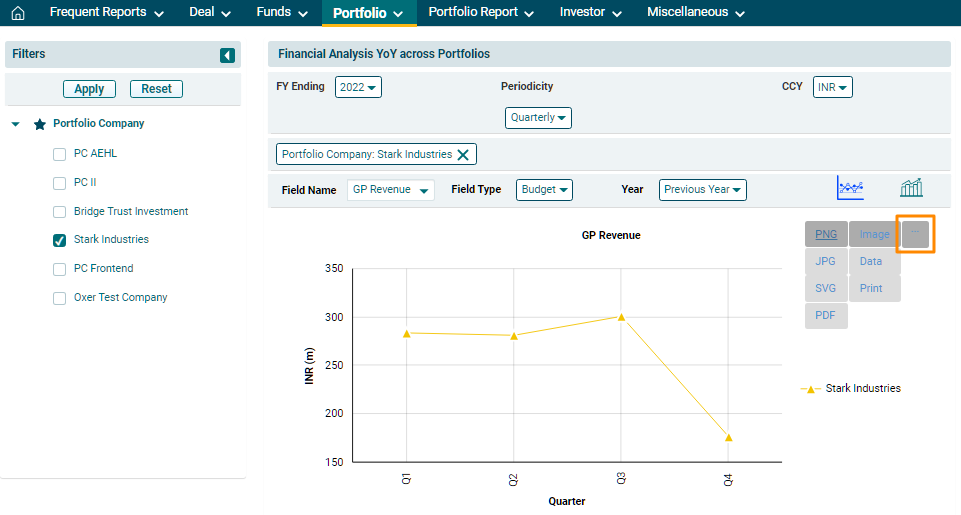
3. The Financial Analysis YoY Across Portfolios window is displayed. Using the filters on the left-hand side, select the Portfolio Company. Click Apply.
4. It displays the data in the Line Chart form based on the set parameters.
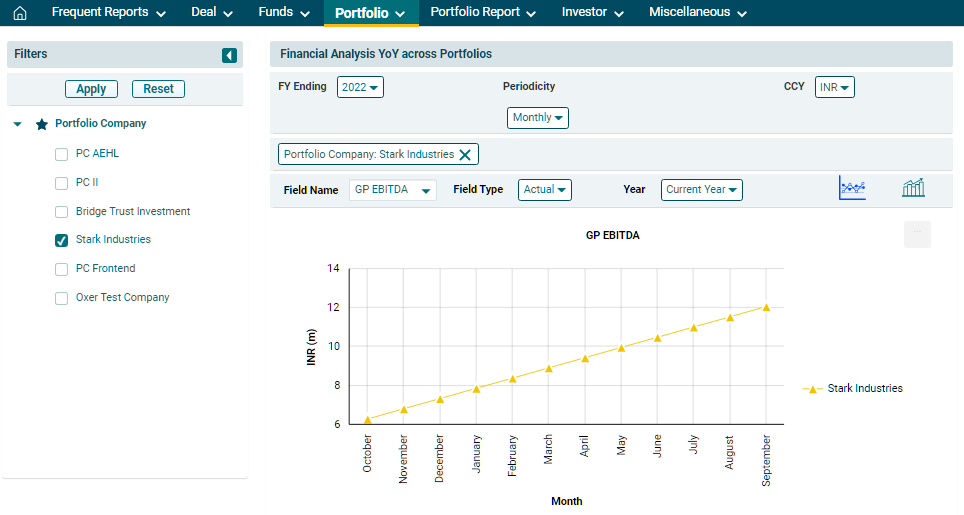 5. You can also view the report using various filters available above the graph.
- FY Ending: To specify the year for which you wish to see the performance.
- Periodicity: To specify the period for which you wish to see the results, i.e. Monthly, Quarterly, Half-Yearly, or Annual.
- CCY: To specify the currency.
- Field Name: To specify the field name of which you wish to see the performance analysis, i.e., Profit Before Tax, GP EBIDTA, GP Revenue, etc.
- Field Type: To specify the field Type, i.e. Budget, Actual, or IC.
- Year: To specify the performance for Current Year, Previous Year, or All.
After applying the filters, you can view the chart based on the changed parameters. You can download the report in various formats. Click on the gray square box button in the top right corner near the graph. The report can be downloaded in image formats, such as PNG, SVG, JPG, etc., and data formats, such as JSON, HTML, PDF, CSV, etc. Click on a format and the report will be downloaded.
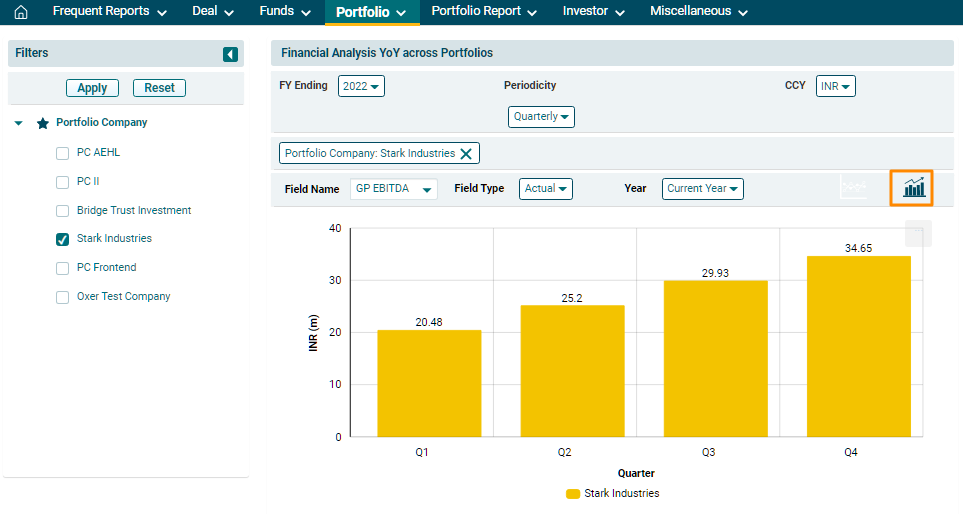
6. You can also view the report in Bar Chart format. Click on the icons below the filters to view the diversification in desired format.